


Business Performance
Orders Received
(million yen)
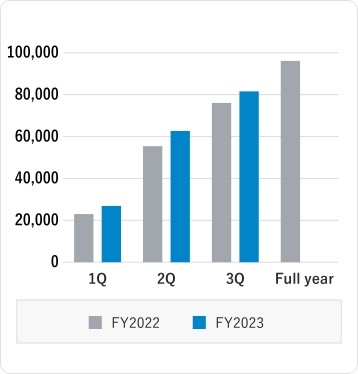
| FY | 1Q | 2Q | 3Q | Full year |
|---|---|---|---|---|
| 2023 | 26,852 | 62,638 | 81,547 | |
| 2022 | 22,972 | 55,373 | 76,029 | 96,095 |
Net Sales
(million yen)
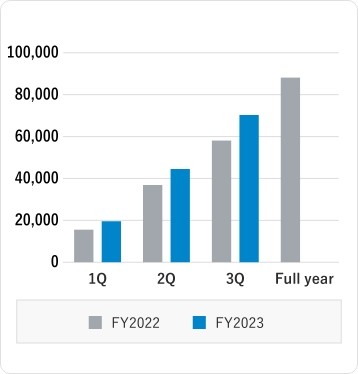
| FY | 1Q | 2Q | 3Q | Full year |
|---|---|---|---|---|
| 2023 | 19,554 | 44,491 | 70,267 | |
| 2022 | 15,539 | 36,868 | 58,066 | 88,109 |
Operating Profit
(million yen)
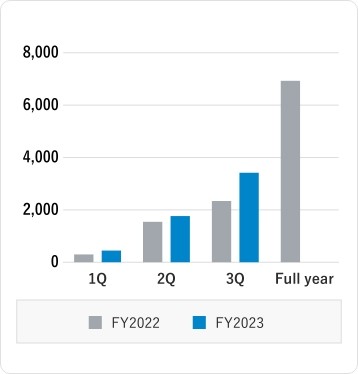
| FY | 1Q | 2Q | 3Q | Full year |
|---|---|---|---|---|
| 2023 | 444 | 1,763 | 3,417 | |
| 2022 | 297 | 1,542 | 2,338 | 6,926 |
Profit Attributable to
Owners of Parent
(million yen)
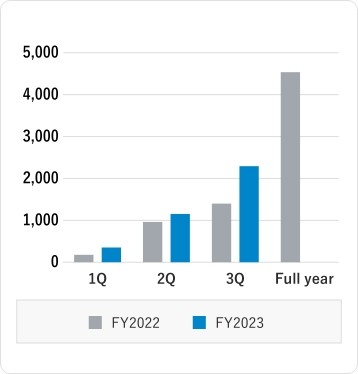
| FY | 1Q | 2Q | 3Q | Full year |
|---|---|---|---|---|
| 2023 | 351 | 1,152 | 2,292 | |
| 2022 | 176 | 961 | 1,399 | 4,536 |