


Sales / Profit and Loss
| Category | FY 2020 |
FY 2021 |
FY 2022 |
|---|---|---|---|
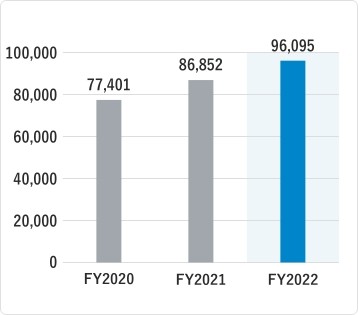
| Orders received | 77,401 | 86,852 | 96,095 |
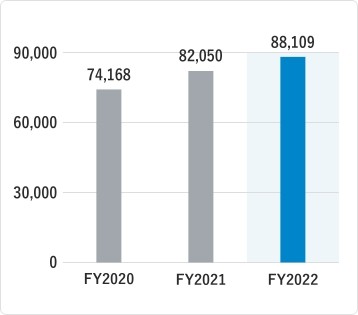
| Net sales | 74,168 | 82,050 | 88,109 |
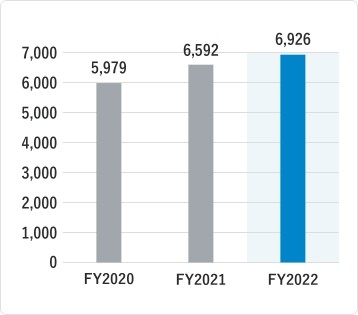
| Operating profit | 5,979 | 6,592 | 6,926 |
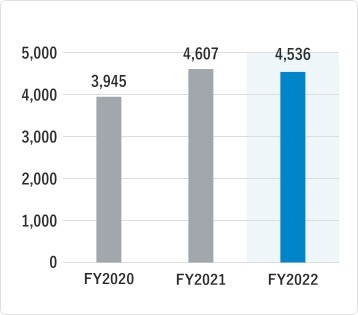
| Profit attributable to owners of parent | 3,945 | 4,607 | 4,536 |
Orders Received
(million yen)
Net Sales
(million yen)
Operating Profit
(million yen)
Profit Attributable to
Owners of Parent
(million yen)
Balance Sheet
| Category | FY 2020 |
FY 2021 |
FY 2022 |
|---|---|---|---|
| Total assets | 56,341 | 62,654 | 70,200 |
| Total current assets | 51,277 | 57,324 | 64,479 |
| Total non-current assets | 5,063 | 5,330 | 5,720 |
| Total liabilities | 26,660 | 28,987 | 32,617 |
| Current liabilities | 24,042 | 26,466 | 30,325 |
| Non-current liabilities | 2,618 | 2,521 | 2,292 |
| Net assets | 29,680 | 33,666 | 37,582 |
Cash Flow
| Category | FY 2020 |
FY 2021 |
FY 2022 |
|---|---|---|---|
| Cash flows from operating activities |
7,843 | 3,450 | 7,711 |
| Cash flows from investing activities |
△392 | △306 | △354 |
| Cash flows from financing activities |
△465 | △1,075 | △878 |
| Cash and cash equivalents at end of period |
14,316 | 16,464 | 23,098 |
Indicators
| Category | FY 2020 |
FY 2021 |
FY 2022 |
|---|---|---|---|
| Basic earnings per share (Yen) | 438.77 | 512.39 | 504.43 |
| Net assets per share (Yen) | 3,218.72 | 3,663.01 | 4,102.31 |
| ROA (%) | 10.8 | 11.3 | 10.6 |
| ROE (%) | 14.5 | 14.9 | 13.0 |
| Capital adequacy ratio (%) | 51.4 | 52.6 | 52.6 |
| Total number of issued shares (Shares) | 9,026,561 | 9,026,561 | 9,026,561 |
※On the 1st October 2018 a reverse stock split was carried out at the rate of 1 share for every 5 shares of common stock. The net assets per share and net profits per share are calculated on the assumption that the reverse stock split was carried out at the beginning of fiscal 2017.